Many students, researchers, and data analysts get confused when learning the difference between ratio and interval scales. At first glance, both seem similar because they deal with numerical data, measurements, and statistical analysis. However, they serve different purposes and have unique characteristics that affect how data is interpreted.
Understanding the difference between ratio and interval is essential in fields such as statistics, psychology, education, healthcare, business analytics, and modern digital platforms. Whether you are analyzing survey results, tracking performance metrics, or interpreting research findings, knowing when to use an interval scale versus a ratio scale can improve the accuracy of your conclusions.
In this guide, you will learn the difference between ratio and interval, how each measurement scale works, real-world examples, similarities, common mistakes, practical applications, and expert insights. By the end, you will clearly understand which scale is appropriate for different types of data.
Quick Answer: Difference Between Ratio and Interval
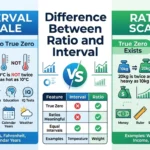
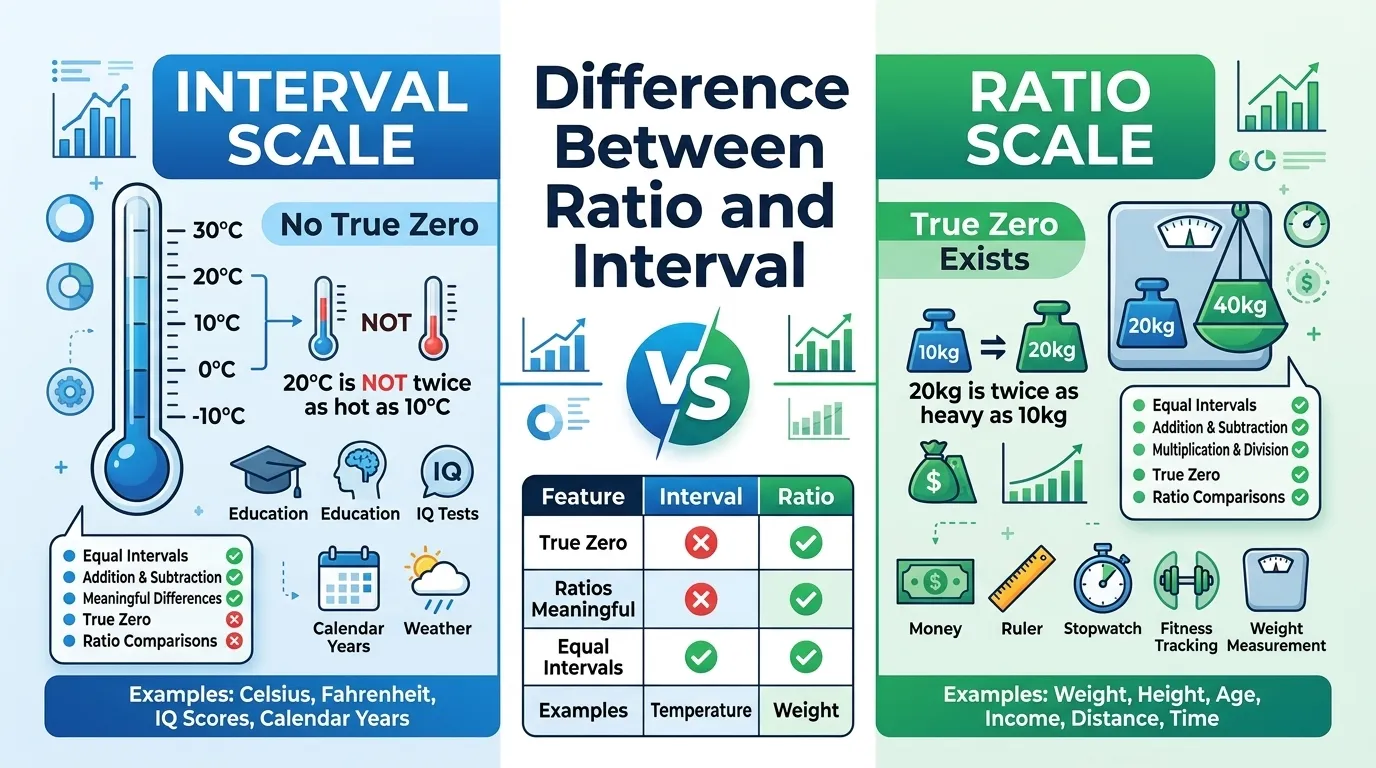
The main difference between ratio and interval scales is that a ratio scale has a true zero point, while an interval scale does not.
For example:
- Temperature in Celsius is an interval scale because 0°C does not mean the complete absence of temperature.
- Weight in kilograms is a ratio scale because 0 kg means no weight exists.
Because ratio scales have a true zero, you can make meaningful multiplication and division comparisons. Interval scales only allow meaningful differences between values.
Definition of Ratio and Interval
- Interval Scale: A measurement scale where the difference between values is meaningful, but there is no true zero point.
- Ratio Scale: A measurement scale where differences are meaningful and a true zero point exists, allowing ratio comparisons.
Example
- Interval: 20°C is 10 degrees warmer than 10°C.
- Ratio: 20 kg is twice as heavy as 10 kg.
Pronunciation of Both Terms (US & UK)
| Term | US Pronunciation | UK Pronunciation |
| Ratio | RAY-shee-oh | RAY-shee-oh |
| Interval | IN-ter-vuhl | IN-tuh-vuhl |
Now that you know how these terms are pronounced, let’s explore the deeper concepts that create the distinction between these two important measurement scales.
Difference Between Ratio and Interval Scale Comparison Table
| Feature | Interval Scale | Ratio Scale |
| Zero Point | No true zero | True zero exists |
| Meaningful Differences | Yes | Yes |
| Meaningful Ratios | No | Yes |
| Addition/Subtraction | Allowed | Allowed |
| Multiplication/Division | Not meaningful | Meaningful |
| Example | Temperature in Celsius | Weight in kilograms |
| Data Analysis | Moderate flexibility | Highest flexibility |
| Statistical Operations | Many possible | All possible |
| Research Usage | Common in surveys | Common in scientific measurements |
| Absolute Quantity | Cannot represent absence | Can represent absence |
Key Differences Explained Between Ratio and Interval
1. Presence of a True Zero
The most important distinction is the existence of a true zero point.
In a ratio scale, zero means complete absence.
Example: 0 kilograms means no weight.
In an interval scale, zero is simply a reference point.
Example: 0°C does not mean temperature does not exist.
2. Ratio Comparisons
Ratio scales support statements like:
- “40 kg is twice as heavy as 20 kg.”
- “100 dollars is twice as much as 50 dollars.”
These statements are valid because ratio scales have a true zero.
Interval scales do not support such comparisons.
For example, 20°C is not twice as hot as 10°C.
3. Mathematical Operations
With ratio data, all mathematical operations are meaningful.
Researchers can calculate:
- Mean
- Median
- Mode
- Ratios
- Percentages
- Coefficients
Interval data supports many statistical calculations but not true ratio comparisons.
4. Measurement Precision
Ratio scales generally provide the highest level of measurement precision because they contain all properties of other scales.
This makes them valuable in scientific research, engineering, healthcare, and business intelligence.
5. Real-World Interpretation
A ratio scale often measures tangible quantities.
Examples include:
- Height
- Weight
- Distance
- Time duration
- Income
Interval scales frequently measure values where differences matter more than absolute quantities.
Examples include:
- Temperature
- IQ scores
- Calendar years
6. Research Applications
Social scientists often use interval scales for psychological measurements.
Scientists and engineers commonly use ratio scales because they require absolute measurements.
7. Data Analysis Flexibility
Ratio scales provide greater flexibility in advanced statistical modeling because all mathematical relationships remain meaningful.
This is one reason why many machine learning systems and modern analytics platforms prefer ratio-based variables when possible.
What Is an Interval Scale?
An interval scale is a quantitative measurement scale where equal differences between values represent equal differences in the measured attribute.
The key limitation is the absence of a true zero point.
Common Examples
- Temperature in Celsius
- Temperature in Fahrenheit
- IQ Scores
- Calendar Years
- SAT Scores
For example:
The difference between 10°C and 20°C is the same as the difference between 20°C and 30°C.
This consistency makes interval scales useful for measuring change and variation.
What Is a Ratio Scale?
A ratio scale contains all characteristics of an interval scale plus a meaningful zero point.
This makes ratio scales the most informative measurement scale in statistics.
Common Examples
- Weight
- Height
- Age
- Income
- Distance
- Time Duration
For example:
A person weighing 80 kg is truly twice as heavy as someone weighing 40 kg.
That comparison is mathematically valid because the scale begins at absolute zero.
Why Does the Difference Between Ratio and Interval Matter?
Many beginners wonder why statisticians place so much importance on measurement scales.
The answer is simple.
Using the wrong scale can lead to incorrect conclusions.
For example:
A researcher who treats interval data as ratio data may make misleading statements about proportional relationships.
In business analytics, healthcare research, and academic studies, this mistake can significantly impact decision-making.
How Does a True Zero Change Data Interpretation?
The concept of a true zero affects how we understand measurements.
Without a True Zero
You can compare differences.
Example:
- 30°C is 10 degrees warmer than 20°C.
With a True Zero
You can compare differences and proportions.
Example:
- 30 kg is three times heavier than 10 kg.
This additional capability makes ratio scales more powerful for analysis.
Real-World Examples of Difference Between Ratio and Interval
Example 1: Weather Forecasting
Meteorologists often use Celsius temperatures.
Because Celsius lacks a true zero, it is classified as an interval scale.
Example 2: Fitness Tracking
Apps developed by companies like Google and Apple often measure:
- Steps
- Distance
- Calories
These are ratio-scale measurements because zero represents absence.
Example 3: Education Testing
IQ tests use interval scales.
A score of 120 is not twice the intelligence of a score of 60.
Example 4: Financial Reporting
Revenue, profit, and expenses generally use ratio scales because zero represents no monetary value.
Difference and Similarity Between Ratio and Interval
| Feature | Interval Scale | Ratio Scale | Similarity |
| Meaning | Measures differences between values | Measures differences and absolute quantities | Both are quantitative measurement scales |
| Zero Point | No true zero | Has a true zero | Both use numerical values |
| Equal Intervals | Yes | Yes | Equal spacing between measurements |
| Addition & Subtraction | Meaningful | Meaningful | Both support these calculations |
| Multiplication & Division | Not meaningful | Meaningful | Both are used in statistical analysis |
| Research Usage | Common in psychology and education | Common in science and business | Both are important in data collection |
| Data Analysis | Supports many statistical methods | Supports all major statistical methods | Both help researchers interpret data |
| Examples | Celsius temperature, IQ scores | Height, weight, age, income | Both represent measurable information |
This table clearly shows the difference and similarity between ratio and interval for quick understanding.
Common Mistakes with Ratio and Interval
Many students and researchers understand the definitions but still make practical mistakes. Here are the most common errors and how to avoid them.
1. Assuming Every Numerical Value Is Ratio Data
A number alone does not automatically mean ratio data.
Mistake: Treating IQ scores as ratio measurements.
Correction: IQ scores are interval data because zero does not represent a complete absence of intelligence.
2. Misunderstanding Zero
Many beginners assume that every zero value means “nothing.”
Mistake: Thinking 0°C means no temperature exists.
Correction: Celsius temperature uses an arbitrary zero point, making it an interval scale.
3. Using Ratio Statements on Interval Data
This is one of the most common statistical errors.
Mistake: Saying 40°C is twice as hot as 20°C.
Correction: Temperature differences are meaningful, but ratio comparisons are not.
4. Selecting the Wrong Statistical Method
Different measurement scales require different analytical approaches.
Mistake: Applying ratio-based interpretations to interval-scale survey data.
Correction: Always identify the measurement scale before analysis.
5. Confusing Equal Intervals with True Zero
Both scales have equal intervals, which often causes confusion.
Mistake: Assuming equal intervals automatically create a ratio scale.
Correction: A ratio scale must also contain a true zero point.
6. Ignoring Context
The same concept may be measured differently depending on the situation.
Mistake: Treating all time-related measurements as interval scales.
Correction: Time duration is ratio data, while calendar years are interval data.
Real-Life Examples with Ratio and Interval
Understanding real-world applications makes the concept much easier.
Personal Example: Body Weight
A person’s weight can be measured in kilograms.
- 0 kg means no weight.
- 80 kg is twice 40 kg.
This is ratio data.
Personal Example: Weather Temperature
A weather app shows:
- 10°C
- 20°C
- 30°C
The difference between values matters, but 30°C is not three times hotter than 10°C.
This is interval data.
Business Example: Revenue Analysis
A company tracks monthly revenue.
- $0 revenue means no revenue.
- $100,000 is twice $50,000.
This represents ratio-scale measurement.
Educational Example: IQ Scores
Psychologists often analyze IQ results.
A score of 120 does not mean a person is twice as intelligent as someone scoring 60.
This represents interval-scale data.
Healthcare Example
Doctors may track:
- Patient weight (ratio scale)
- Body temperature in Celsius (interval scale)
Both are numerical measurements but belong to different statistical categories.
Technology Example
Platforms such as Google, YouTube, and Instagram analyze large amounts of quantitative data.
Metrics like:
- Watch time
- Followers
- Views
- Ad revenue
are typically ratio-scale measurements because zero represents an absence of the metric.
When to Use Each
When to Use an Interval Scale
Use interval scales when:
- Equal differences matter
- Zero is arbitrary
- Measuring temperature in Celsius or Fahrenheit
- Measuring standardized test scores
- Measuring calendar dates
Best Situations
- Educational assessments
- Psychological testing
- Climate research
- Historical timeline analysis
When to Use a Ratio Scale
Use ratio scales when:
- Absolute quantities matter
- A true zero exists
- Proportional comparisons are needed
- Scientific accuracy is important
Best Situations
- Engineering measurements
- Business analytics
- Financial reporting
- Medical research
- Fitness tracking
Why People Get Confused About Ratio and Interval
Many users search for the difference between ratio and interval because the two scales share several characteristics.
Both Use Numbers
At first glance, interval and ratio data appear identical because both involve numerical measurements.
Both Have Equal Intervals
The spacing between values remains consistent in both scales.
This similarity often hides the importance of the true zero point.
Statistics Courses Introduce Them Together
Most textbooks teach measurement scales in the same chapter.
Students often remember the similarities but forget the critical distinction.
Real-World Examples Can Be Misleading
Temperature is the most common source of confusion.
Many people assume that because Celsius uses numbers, it must support ratio comparisons.
In reality, it does not.
Software Handles Both Similarly
Modern tools like spreadsheets, analytics dashboards, and business intelligence platforms can process both interval and ratio data.
Because the calculations look similar, users may overlook the underlying statistical differences.
Expert Insight
From a statistical and research perspective, the most important factor separating ratio and interval scales is not the numbers themselves but the meaning behind zero.
In real research scenarios, many beginners focus on the numerical values and overlook the measurement framework. However, professional analysts know that choosing the correct scale determines which statistical methods are valid.
For example:
- A psychologist analyzing IQ scores must treat them as interval data.
- A healthcare researcher measuring patient weight must treat it as ratio data.
- A business analyst evaluating revenue growth relies on ratio-scale measurements.
Understanding this distinction helps prevent inaccurate conclusions and improves the reliability of research findings.
A simple rule many professionals use is:
“If zero means none, it is probably a ratio scale. If zero is just a reference point, it is probably an interval scale.”
Frequently Asked Questions (FAQs)
What is the main difference between ratio and interval?
The primary difference is that a ratio scale has a true zero point, while an interval scale does not.
Is temperature ratio or interval?
Temperature measured in Celsius or Fahrenheit is an interval scale. Temperature measured in Kelvin is a ratio scale because Kelvin has a true zero.
Why is IQ considered an interval scale?
IQ scores have equal intervals, but zero does not represent the absence of intelligence.
Is age a ratio variable?
Yes. Age is a ratio variable because zero years represents no age, and meaningful ratio comparisons can be made.
Can interval data be multiplied or divided?
Not meaningfully. Ratio comparisons require a true zero point.
Which scale is more powerful for analysis?
Ratio scales are generally considered more powerful because they support all mathematical operations.
Is income ratio or interval data?
Income is ratio data because zero income represents no income and proportional comparisons are meaningful.
Why is Kelvin a ratio scale?
Kelvin uses absolute zero, which represents the complete absence of thermal energy.
Are calendar years interval or ratio?
Calendar years are interval data because the zero point is arbitrary.
Why is understanding measurement scales important?
Choosing the correct measurement scale helps researchers use appropriate statistical methods and avoid misleading conclusions.
Conclusion
Understanding the difference between ratio and interval is essential for anyone working with statistics, research, data analysis, business intelligence, education, or scientific measurements. Although both scales involve numerical data and equal intervals, the key distinction lies in the presence of a true zero point.
An interval scale allows meaningful comparisons between differences but lacks a true zero. Examples include Celsius temperature, Fahrenheit temperature, and IQ scores. A ratio scale, on the other hand, includes a true zero and supports both difference and ratio comparisons. Examples include age, weight, height, income, distance, and time duration.
Many users get confused because both scales appear similar and are often analyzed using similar statistical methods. However, understanding the role of zero changes how data should be interpreted and which calculations are valid.
=

I am content creator and comparison blogger focused on analyzing key differences between terms, concepts, and ideas to deliver accurate, easy-to-understand information. So I decided to create a platform where these differences are explained in the simplest way possible.